RequestBite Inspector
What is Inspector?
RequestBite is a simple and easy-to-use service that allows you to inspect webhook and HTTP requests and proxy them to arbitrary targets. Go to requestbite.com/view and the service will automatically create a unique URL to which you can send your data for review.
The service collects and prints the following data:
- Request headers
- Query strings
- Form fields
- Uploaded files
- Request body
Awaiting your first request
This is what the page looks like before you have sent your first request:
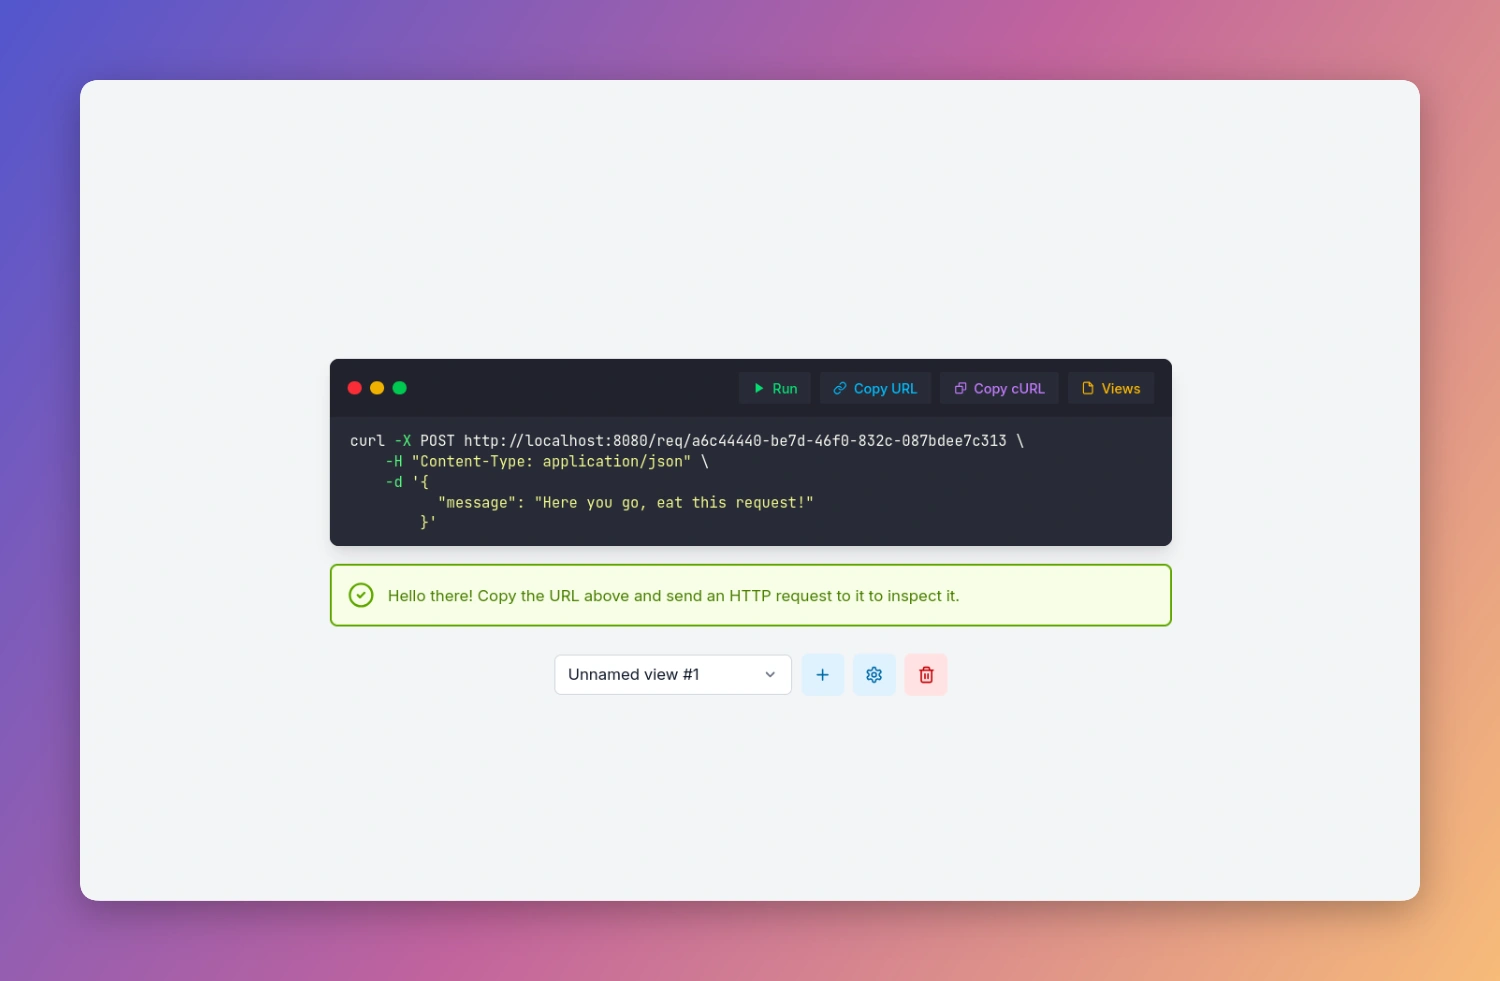
Functionality of page
Available functionality before having received your first view:
Top-right corner
- Run request
This submits a POST request with a JSON payload to the server, similarly to what thecurlcommand in the terminal window would do. This request is made directly from your browser and not forwarded through any backend. - Copy URL
Copies the unique request URL to your clipboard. - Copy cURL command
Copies the fullcurlcommand to your clipboard. If you're running a Linux or Mac system, you can paste this command into your terminal window and run it. - Views (not always present)
If you're logged into your RequestBite account, this button links to the Views admin page in RequestBite HQ.
Below terminal view
- Dropdown
If you have more than one view avaialble, then you can click the dropdown and select another one. If the selected view has received requests, you will be redirect to the request dashboard. - Add (plus)
Allows you to create a new view. - Settings (cog-wheel)
Allows you to rename your view. If you're logged in, you're redirected to the admin page for this view in RequestBite HQ. - Delete (bin) (not always present)
This button deletes the current view. A view is the unique URL that you can submit your requests to. If you have more than one view, then you can also delete them one by one and their associated requests. When you delete a view, you will be automatically redirected to your next available view.
The Request Dashboard
The Request Dashboard is what we call the page where you can see all requests for a given view as well as inspect them individually:
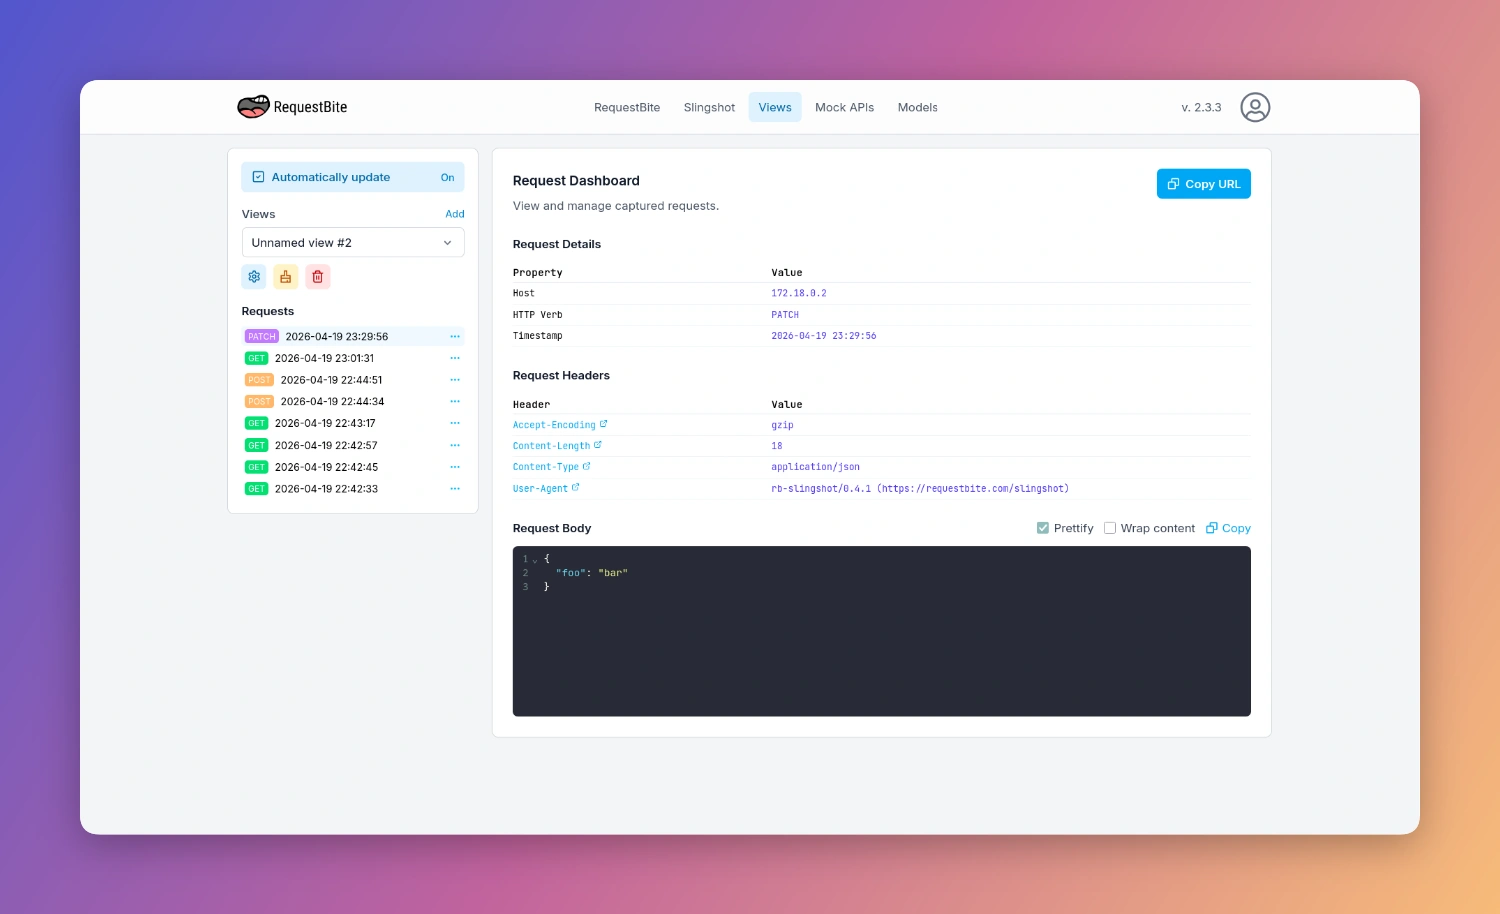
The following data is presented for each request:
Request details
- Host
The public IPv4 or IPv6 address of the client sending the request. - HTTP verb
The HTTP method used in the request (e.g.GET,POST,PUT,DELETE). - Timestamp
The date and time in UTC when the request was received.
Request headers
This section lists all request headers sent by the client as key-value pairs.
Query strings
INFO
This section is only present if query strings are sent by the client.
This section lists all query strings sent by the client like this:
foo: bar
Form fields
INFO
This section is only present if form fields are sent by the client.
If you send a request with a Content-Type: application/x-www-form-urlencoded or Content-Type: multipart/form-data header, then any textual form fields will be displayed in this section, i.e. what is commonly sent in regular HTML forms with <input> fields by web browsers.
Example output:
name_of_field: Value of field
Files
INFO
This section is only present if files are uploaded by the client.
If you send a request with a Content-Type: multipart/form-data header (or if the request body only contains binary data), then any files uploaded will be displayed in this section in combination with their mime type and size.
It is also possible to download an uploaded file by clicking the download icon.
Example output:
name_of_field: image.svg - image/svg+xml - 28,805 bytes
Request Body
INFO
This section is only present if a body payload is sent by the client.
This section shows the request body sent by the client. If the body is JSON, it will by default be pretty-printed and syntax-highlighted. You can toggle if you want to disable the pretty-printing or if you want to wrap the content through two checkboxses in the top right of the printout.
Functionality on the page
Functionality on the Request Dashboard:
Sidebar
- Automatically update
If you have this checkbox ticked, you will automatically be redirected to any new requests coming in. This is handy if you want to "tail" any requests you send for debugging purposes. If instead you want to focus on a specific request and ignore any new ones, you can uncheck this box. - Settings (cog-wheel)
Redirects you to the Settings page for this particular view. - Clear view (brush)
This will delete all requests for the current view. You will be asked to confirm this action. When all requests are deleted, you will be redirect to the entry page for the view. - Delete view (bin)
This will delete the current view and all its associated requests. Just like the Clear view button, you will be asked to confirm this action. If you have more than one view, you will be redirect to your next available view. If you don't have any more views, you will be redirected to the entry page for a new view. - Request context menu > Copy Permalink
This will copy the URL of the current view to your clipboard. - Request context menu > Delete...
This will delete the selected request.
Upper Right Corner
Buttons:
- Replay
Replaying a request allows you to re-send the logged request as stored to an arbitrary URL. This is very useful during e.g. development if you're building a function to handle a specific payload. Then instead of triggering it from some external service, you can just replay it until you're happy with your implementation. - Copy URL
Copies the URL of the Inspector view to the clipboard. It's this URL you should send data to to have it logged by Inspector.
Request Body
If the HTTP call included a request body, you also have access to the following:
- Prettify
For JSON data, this will auto-format the received data so it's easier to inspect. - Wrap content
By default long content is not wrapped in order to to break the original structure of the data being received. Click this checkbox to make sure the returned data is wrapped and thus always fits the screen. - JSONata
Clicking this toggle allows you to search and filter returned data using JSONata - a powerful query and transformation language. - Copy
Copies the entire response payload to your clipboard.
Returned data
When you make a request, the service returns a link to the HQ web page where you can inspect the results. It will also return the data sent in, so that you can immediately see the data it retrieved.
Example:
{
  "info": "Inspect request at http://localhost:8080/view/ID",
  "status": "success",
  "httpMethod": "GET",
  "requestHeaders": [
    {
      "name": "Accept",
      "value": "*/*"
    },
    {
      "name": "User-Agent",
      "value": "curl/7.88.1"
    }
  ]
}
... so that you can click the link and inspect the request.
Please note that if you have URL forwarding enabled and have enabled Return response from forwarded URL, then the actual response from your target URL will be returned here, not the default Inspector response.
Rate Limiting
To ensure fair use and service stability, incoming requests to a view URL are rate limited.
The baseline limit is 1 request per second per view. On top of that, short bursts are allowed: you can send up to 10 additional requests within any 30-second window before the limit kicks in. This means you can send at most 40 requests in a 30-second period for a single view.
If you exceed the limit, the service will respond with an HTTP 429 Too Many Requests status. The window resets automatically after 30 seconds, after which you can send requests again at the normal rate.
INFO
Rate limiting is applied per view URL.
Man-in-the-Middle proxy
Proxy for incoming or outgoing webhooks
Inspector can easily be used as a man-in-the-middle proxy e.g. for webhooks.
Let's say you're building a service that acts on webhook data from Stripe.
During the development phase you can proxy your Stripe webhooks through Inspector and onwards to your local service and have Inspector log the webhooks so that you get a clear record of what data is received by your service.
Pre-requisites:
- An active Request Inspector view.
- A way for Inspector to reach your local service (e.g. via a RequestBite tunnel).
- If you're logging outgoing webhooks from a local service you don't need to worry about local access.
To proxy these incoming webhooks, do like this:
- Copy the Inspector request URL and configure Stripe to send its webhooks to it (by clicking the name of the view in the Views list, opening the
...menu at the far right and selectingCopy URLin the dropdown). - Open the view configuration page by clicking the
...menu again and selectingEdit. In the view that opens, configure it like so:- Tick the checkbox
Forward requests to external URL. - Add the URL to your local service, e.g. via a RequestBite Tunnel such as
https://tunnel-e12345678.t.rbite.dev/stripe/webhooks/ - If it's important for Stripe (in this case) to get the actual response from your service and not the default response from Inspector, also tick the chekbox
Return response from forwarded URL.
- Tick the checkbox
- Click
Save.
Any webhook that Stripe now emits to this request URL will be forwarded verbatim by Inspector to your local service - perfect for debugging during development.
Proxy for outgoing API calls
The difference between using Inspector for API calls as opposed to webhooks (as described above) is that webhooks only require a static URL that requests are sent to, whereas API calls are dynamic and can be sent to any number of target URLs.
In order to use Inspector for API calls (or any other traffic you want to log), follow steps 1-2 in the section above and make sure Return response from forwarded URL is ticked.
To support the possibility to forward requests to any target URL, you must tick at least one of the following two checkboxes:
Allow external URL override via incoming headeror ...Allow external URL override via incoming query string parameter
Then click Save.
Send API call via header
If you clicked Allow external URL override via incoming header, then you can now proxy and log your API calls by specifying the target URL via the HTTP header value x-forward-to-url.
Let's say you want to log an API call to https://example.com:
curl \
  -X POST \
  -H 'x-forward-to-url: https://example.com' \
  -H 'Content-Type: application/json' \
  -d '{
    "foo": "bar"
  }' \
  https://api.requestbite.com/req/5c6eb790-a84a-4be2-8c7c-e2b2454b2f73
The important part here is that the last URL (https://api.requestbite.com...) points to your Inspector view, and that the header x-forward-to-url is specifying the actual URL that you want to call.
Any other data will be passed on verbatim to the target URL. The call above is the same as calling:
curl \
  -X POST \
  -H 'Content-Type: application/json' \
  -d '{
    "foo": "bar"
  }' \
  https://example.com
... except that we're not also logging the data.
Send API call via query parameter
If you clicked Allow external URL override via incoming query string parameter, then you can now proxy and log your API calls by specifying the target URL in URL-encoded format via the query string parameter x-forward-to-url.
Like above, let's say you want to log an API call to `https://example.com:
curl \
  -X POST \
  -H 'Content-Type: application/json' \
  -d '{
  "foo": "bar"
}' \
  'https://api.requestbite.com/req/5c6eb790-a84a-4be2-8c7c-e2b2454b2f73?x-forward-to-url=https%3A%2F%2Fexample.com'
Here the URL you actually want to send the data to is appended as a URL-encoded query-string to the Inspector view URL.
Like above, this would be the equivalent of calling:
curl \
  -X POST \
  -H 'Content-Type: application/json' \
  -d '{
    "foo": "bar"
  }' \
  https://example.com